
The displacement $y(t) = A \sin (\omega t + \phi)$ of a pendulum for $\phi = \frac{2\pi}{3}$ is correctly represented by which of the following graphs?
- A
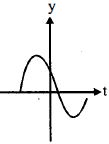
- B
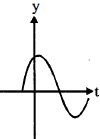
- C
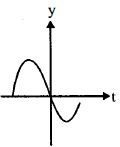
- D
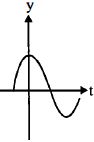
Explore More
Similar Questions
The phase of a particle executing simple harmonic motion is $\frac{\pi}{2}$ when it has:
Medium
View SolutionThe diagram shows two oscillations. What is the phase difference between the oscillations?
Medium
View SolutionIn the following table,time is in column-$I$ and the phase of an oscillator starting from the mean position is in column-$II$. Match them appropriately.
Column-$I$ Column-$II$ $(a)$ $t = \frac{T}{8}$ $(i)$ $\theta = \frac{5\pi}{4}$ $(b)$ $t = \frac{5T}{8}$ $(ii)$ $\theta = \frac{3\pi}{2}$ $(iii)$ $\theta = \frac{\pi}{4}$
| Column-$I$ | Column-$II$ |
|---|---|
| $(a)$ $t = \frac{T}{8}$ | $(i)$ $\theta = \frac{5\pi}{4}$ |
| $(b)$ $t = \frac{5T}{8}$ | $(ii)$ $\theta = \frac{3\pi}{2}$ |
| $(iii)$ $\theta = \frac{\pi}{4}$ |
Easy
View SolutionWhich of the following curves represents correctly the oscillation given by $y = y_0 \sin(\omega t - \phi)$,where $0 < \phi < 90^\circ$?
Medium
View SolutionTwo particles are in $SHM$ on the same straight line with amplitudes $A$ and $2A$ and with the same angular frequency $\omega$. It is observed that when the first particle is at a distance $A/\sqrt{2}$ from the origin and moving toward the mean position,the other particle is at the extreme position on the other side of the mean position. Find the phase difference between the two particles. (in $^o$)
Medium
View SolutionVedclass Products
For Students
Vedclass Test Series
Mock tests in real JEE/NEET style with performance analysis. 5-day free trial.
Start Free TrialFor Teachers
Exam Paper Generator
Generate Set A/B/C/D exam papers from 7.5L+ questions in 2 minutes. 3 chapters free.
Try FreeFor Institutes
Online Exam Module
Live online exams with unlimited students, 360° analytics & white-label branding.
See Demo